(This article is from the Real Estate Board of Great Vancouver)
METRO VANCOUVER MARKET HIGHLIGHTS
FEBRUARY 2022
.png)
The Metro Vancouver* housing market saw steady home sales activity, modest increases in home listings and continued upward trends in pricing in February.
The Real Estate Board of Greater Vancouver (REBGV) reports that residential home sales in the region totalled 3,424 in February 2022, an 8.1 per cent decrease from the 3,727 sales recorded in February 2021, and a 49.8 per cent increase from the 2,285 homes sold in January 2022.
Last month’s sales were 26.9 per cent above the 10-year February sales average.
.png)
There were 5,471 detached, attached and apartment properties newly listed for sale on the Multiple Listing Service® (MLS®) in Metro Vancouver in February 2022. This represents an 8.4 per cent increase compared to the 5,048 homes listed in February 2021 and a 31.2 per cent increase compared to January 2022 when 4,170 homes were listed.
The total number of homes currently listed for sale on the MLS® system in Metro Vancouver is 6,742, a 19.3 per cent decrease compared to February 2021 (8,358) and a 19.1 per cent increase compared to January 2022 (5,663).
“Despite having a higher volume of people listing their homes for sale in February, the region’s housing market remains significantly undersupplied, which has been pushing home prices to new highs month after month,” Biggar said.
For all property types, the sales-to-active listings ratio for February 2022 is 50.8 per cent. By property type, the ratio is 34.9 per cent for detached homes, 64.3 per cent for townhomes, and 62.2 per cent for apartments.
.png)
(This article is from the Real Estate Board of Great Vancouver)
Lower Mainland’s commercial real estate market continued its recovery in the third quarter of 2021
Monday, January 24, 2022
The increased activity seen in the Lower Mainland’s commercial real estate market in the first half of 2021 carried into the third quarter (Q3) of the year across all categories.
There were 640 commercial real estate sales in the Lower Mainland in Q3 2021, a 64.1 per cent increase from the 390 sales in Q3 2020, according to data from Commercial Edge, a commercial real estate system operated by the Real Estate Board of Greater Vancouver (REBGV).
The total dollar value of commercial real estate sales in the Lower Mainland was $3.250 billion in Q3 2021, a 30.7 per cent increase from $2.487 billion in Q3 2020.
"Commercial real estate activity recovered steadily in the first three quarters of 2021 against 2020 levels as consumer and business confidence returned from the initial uncertainty that the COVID-19 pandemic caused," Keith Stewart, REBGV economist said. “In particular, the strength of land acquisition activity points to new development interest across the region.”
Q3 2021 activity by category
Land: There were 228 commercial land sales in Q3 2021, which is a 137.5 per cent increase from 96 land sales in Q3 2020. The dollar value of land sales was $1.839 billion in Q3 2021, a 15.5 per cent increase from $1.592 billion in Q3 2020.
Office and Retail: There were 235 office and retail sales in the Lower Mainland in Q3 2021, which is up 42.4 per cent from 165 sales in Q3 2020. The dollar value of office and retail sales was $489 million in Q3 2021, a 41.7 per cent increase from $345 million in Q3 2020.
Industrial: There were 153 industrial land sales in the Lower Mainland in Q3 2021, which is a 43 per cent increase from 107 sales in Q3 2020. The dollar value of industrial sales was $544 million in Q3 2021, a 116.7 per cent increase from $251 million in Q3 2020.
Multi-Family: There were 24 multi-family land sales in the Lower Mainland in Q3 2021, which is up 9.1 per cent from 22 sales in Q3 2020. The dollar value of multi-family sales was $378 million in Q3 2021, a 26.4 per cent increase from $299 million in Q3 2020.
Featured News
(This article is from the website of Real Estate Board of Great Vancouver)
Three things to look out for in Metro Vancouver’s 2022 real estate market

Our Economist Keith Stewart recently presented his 2022 Housing Market Forecast to an online audience of nearly 800 members.
Here are three key takeaways from Keith’s forecast.
Year-over-year sales will decline 9 to 20 per cent in 2022
It’s difficult to set a record for sales two years in a row, so the real question is what kind of decline will we see? Our forecast sees a decline of around 12.5 per cent for the REBGV area, which would be approximately 38,600 sales compared to the record of nearly 44,000 sales in 2021. The declines will vary between areas and property types.
And while doom-and-gloom media headlines would jump on a double-digit decline in a year-over-year sales total, context is important to keep in mind. A sales total of 38,600 in 2022 would be 17 per cent above the 10-year average for the region and would register as the fourth-highest total in the last 10 years.
A continuing lack of supply will keep upward pressure on prices
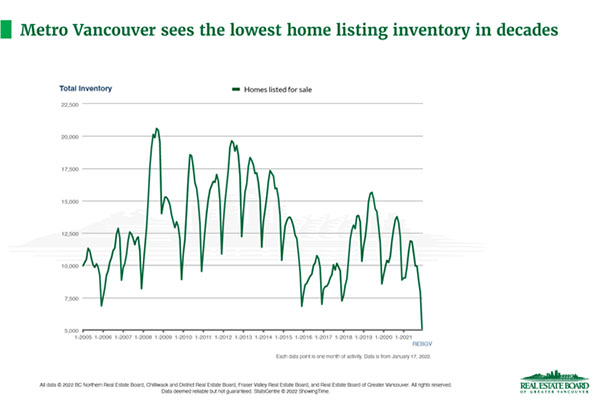
There hasn’t been a smaller pool of homes for the region’s buyers to choose from to start a new year in the last 30 years. Low inventory has been the key driver behind the price growth we saw throughout 2021, and it doesn’t look like there will be relief until at least the second half of 2022.
What will help inventory replenish? New construction of a diverse and more streamlined supply of homes coming onto the market would help break the logjam of availability. The ugly answer? The continued deterioration of affordability will push more potential buyers out of the market.
The X factors: Government intervention and rising interest rates
Rumblings about potential interventions from both the federal and provincial governments have been growing. Provincially, it’s likely the government will implement a cooling-off period for all resales in BC, like what’s in place for pre-sales. Federally, there’s been talk of an “anti-flipping” tax and a ban on so-called blind bidding.
And we already saw interest rates creep up to close 2021. The Bank of Canada will raise rates this year, which will have a suppressing effect on sales. A sharper rise in rates, especially early in the year, will in turn see a sharper decline in sales.
Watch Keith's forecast online
(This article is from the website of Real Estate Board of Great Vancouver)
Metro Vancouver home sales set a record in 2021
2020
30,944
Sold
2021
43,999
Sold
(42.2%)
Residential property sales in Metro Vancouver
Metro Vancouver* home sales reached an all-time high in 2021 as housing needs remained a top priority for residents in the second year of the COVID-19 pandemic.
The Real Estate Board of Greater Vancouver (REBGV) reports that residential home sales in the region totalled 43,999 in 2021, a 42.2 per cent increase from the 30,944 sales recorded in 2020, a 73.6 per cent increase from the 25,351 homes sold in 2019, and a four per cent increase over the previous all-time sales record of 42,326 set in 2015.
Last year’s sales total was 33.4 per cent above the 10-year sales average.
"Home has been a focus for residents throughout the pandemic. With low interest rates, increased household savings, more flexible work arrangements, and higher home prices than ever before, Metro Vancouverites, in record numbers, are assessing their housing needs and options."
Keith Stewart, REBGV economist
Home listings on the Multiple Listing Service® (MLS®) in Metro Vancouver reached 62,265 in 2021. This is a 14.7 per cent increase compared to the 54,305 homes listed in 2020 and a 19.9 per cent increase compared to the 51,918 homes listed in 2019.
Last year’s listings total was 11 per cent above the 10-year average.
“While steady, home listing activity didn't keep pace with the record demand we saw throughout 2021. This imbalance caused residential home prices to rise over the past 12 months,” Stewart said.
The total number of homes currently listed for sale on the MLS® system in Metro Vancouver is 5,236, a 38.7 per cent decrease compared to December 2020 (8,538) and a 26.7 per cent decrease compared to November 2021 (7,144).
“We begin 2022 with just over 5,000 homes for sale across the region. This is the lowest level we’ve seen in more than 30 years,” Stewart said. “With demand at record levels, residents shouldn’t expect home price growth to relent until there’s a more adequate supply of housing available to purchase.”
The MLS® HPI composite benchmark price for all residential properties in Metro Vancouver ends the year at $1,230,200. This is a 17.3 per cent increase compared to December 2020.
Both detached home and townhome benchmark prices increased 22 per cent in the region last year, while apartments increased 12.8 per cent.
Looking across Metro Vancouver, Maple Ridge saw the largest increase in benchmark prices at 34.7 per cent, followed by Pitt Meadows (29.8 per cent), and Whistler (27.8 per cent).
Looking at area and property type, detached homes in Pitt Meadows saw the largest benchmark price increase at 42.2 per cent, followed by detached homes (38.5 per cent) and townhomes (35.2 per cent) in Maple Ridge.
December summary
December 2020
3,093
Sold
December 2021
2,688
Sold
(-13.1%)
Residential property sales in Metro Vancouver
REBGV reports that residential home sales in the region totalled 2,688 in December 2021, a 13.1 per cent decrease from the 3,093 sales recorded in December 2020, and a 21.6 per cent decrease from the 3,428 homes sold in November 2021.
Last month’s sales were 33.4 per cent above the 10-year December sales average.
There were 1,945 detached, attached and apartment properties newly listed for sale on the MLS® in Metro Vancouver in December 2021. This represents a 19.3 per cent decrease compared to the 2,409 homes listed in December 2020 and a 50.9 per cent decrease compared to November 2021 when 3,964 homes were listed.
For all property types, the sales-to-active listings ratio for December 2021 is 51.3 per cent. By property type, the ratio is 35.1 per cent for detached homes, 75.6 per cent for townhomes, and 60.8 per cent for apartments.
Sales to active listings ratio - December 2021
Detached homes
35.1%
Townhomes
75.6%
Condominiums
60.8%
Total 51.3%
Generally, analysts say downward pressure on home prices occurs when the ratio dips below 12 per cent for a sustained period, while home prices often experience upward pressure when it surpasses 20 per cent over several months.
Sales of detached homes in December 2021 reached 794, a 22.6 per cent decrease from the 1,026 sales recorded in December 2020. The benchmark price for a detached home is $1,910,200. This represents a 22 per cent increase from December 2020 and a 2.1 per cent increase compared to November 2021.
Sales of apartment homes reached 1,464 in December 2021, a 1.4 per cent decrease compared to the 1,474 sales in December 2020. The benchmark price of an apartment home is $761,800. This represents a 12.8 per cent increase from December 2020 and a 1.2 per cent increase compared to November 2021.
Attached home sales in December 2021 totalled 430, a 27.5 per cent decrease compared to the 593 sales in December 2020. The benchmark price of an attached home is $1,004,900. This represents a 22 per cent increase from December 2020 and a 1.5 per cent increase compared to November 2021.
l